Translational Molecular Neuroimaging · Aarhus University
Landau Lab.
We study how brain disorders and their treatments change molecular signalling and synaptic biology, with questions relevant to Parkinson's disease and depression. To answer them, we combine molecular imaging with PET, quantitative autoradiography and biological validation in rodents and minipigs.
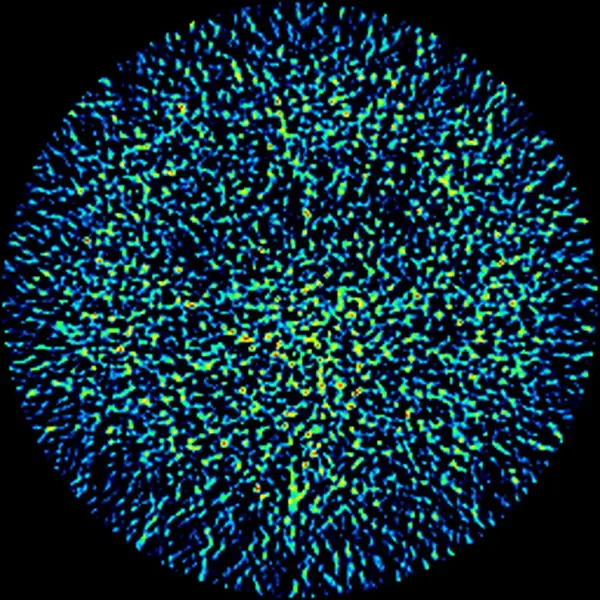
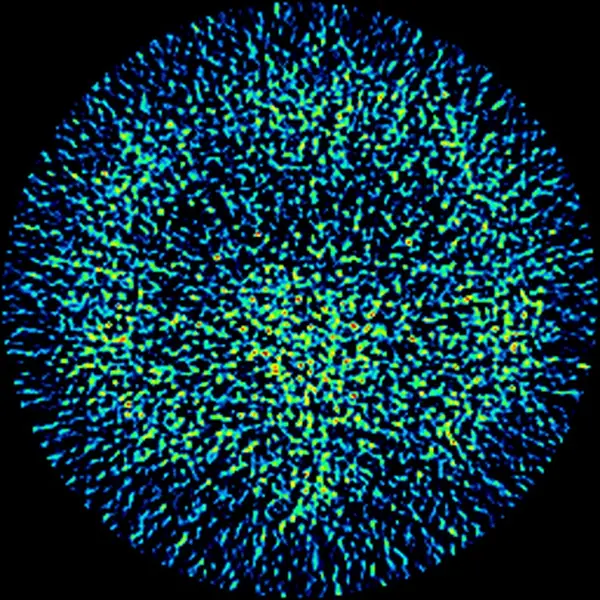
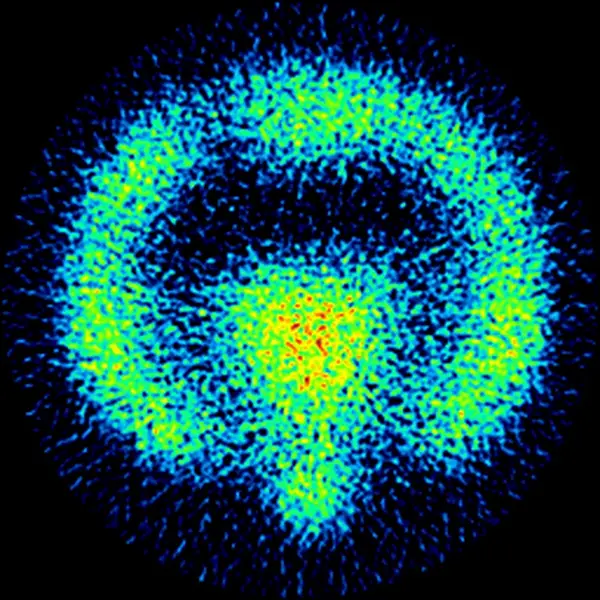
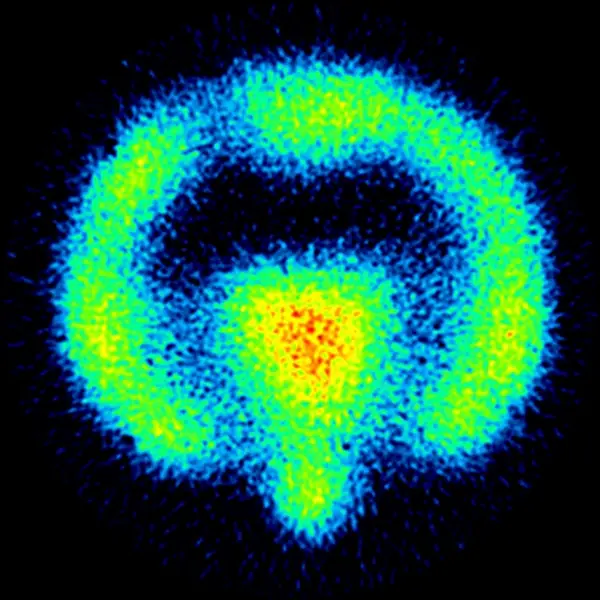
A PET tracer is a molecule that binds a specific target, labelled with a short-lived radioactive atom and given in trace amounts. When the atom decays it emits a positron, which soon meets an electron: the two annihilate into a pair of gamma photons travelling in almost opposite directions.
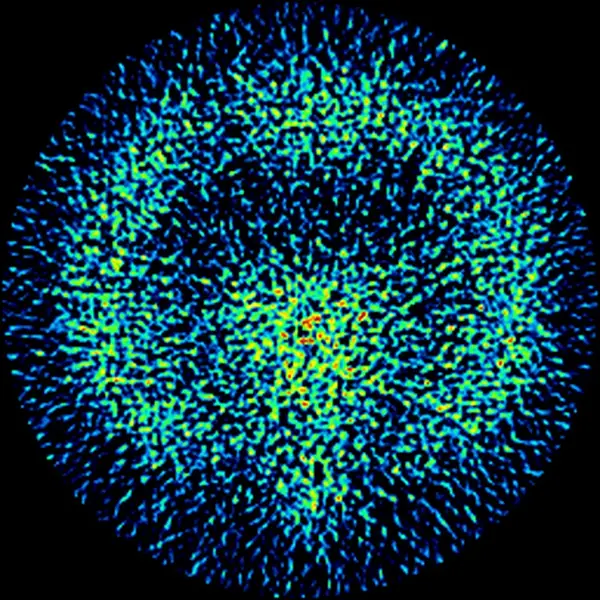
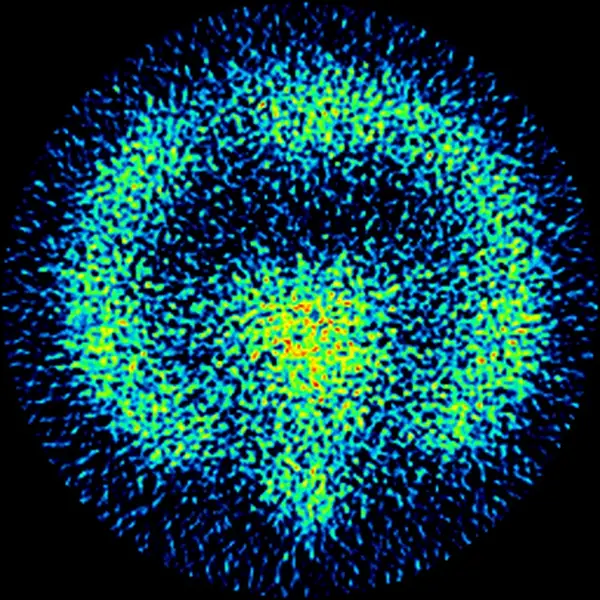
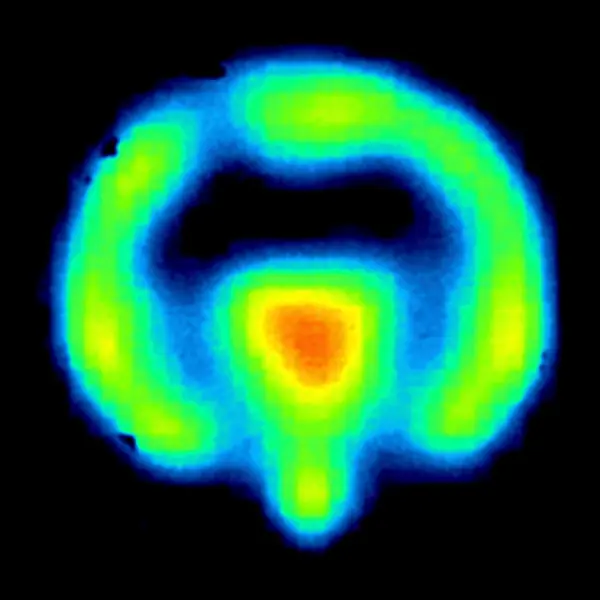
The scanner records these pairs in coincidence, and reconstruction turns millions of them into images of radioactivity. Kinetic modelling of those images over time then gives a measure of binding to the target, like the map this sequence ends on.
Linespairs of photons detected together
Imagereconstructed from the events so far
Final framethe published binding map
Published data
20 thousand1 billionPublished
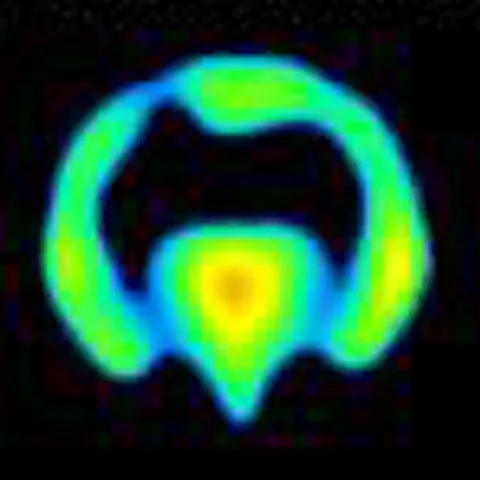
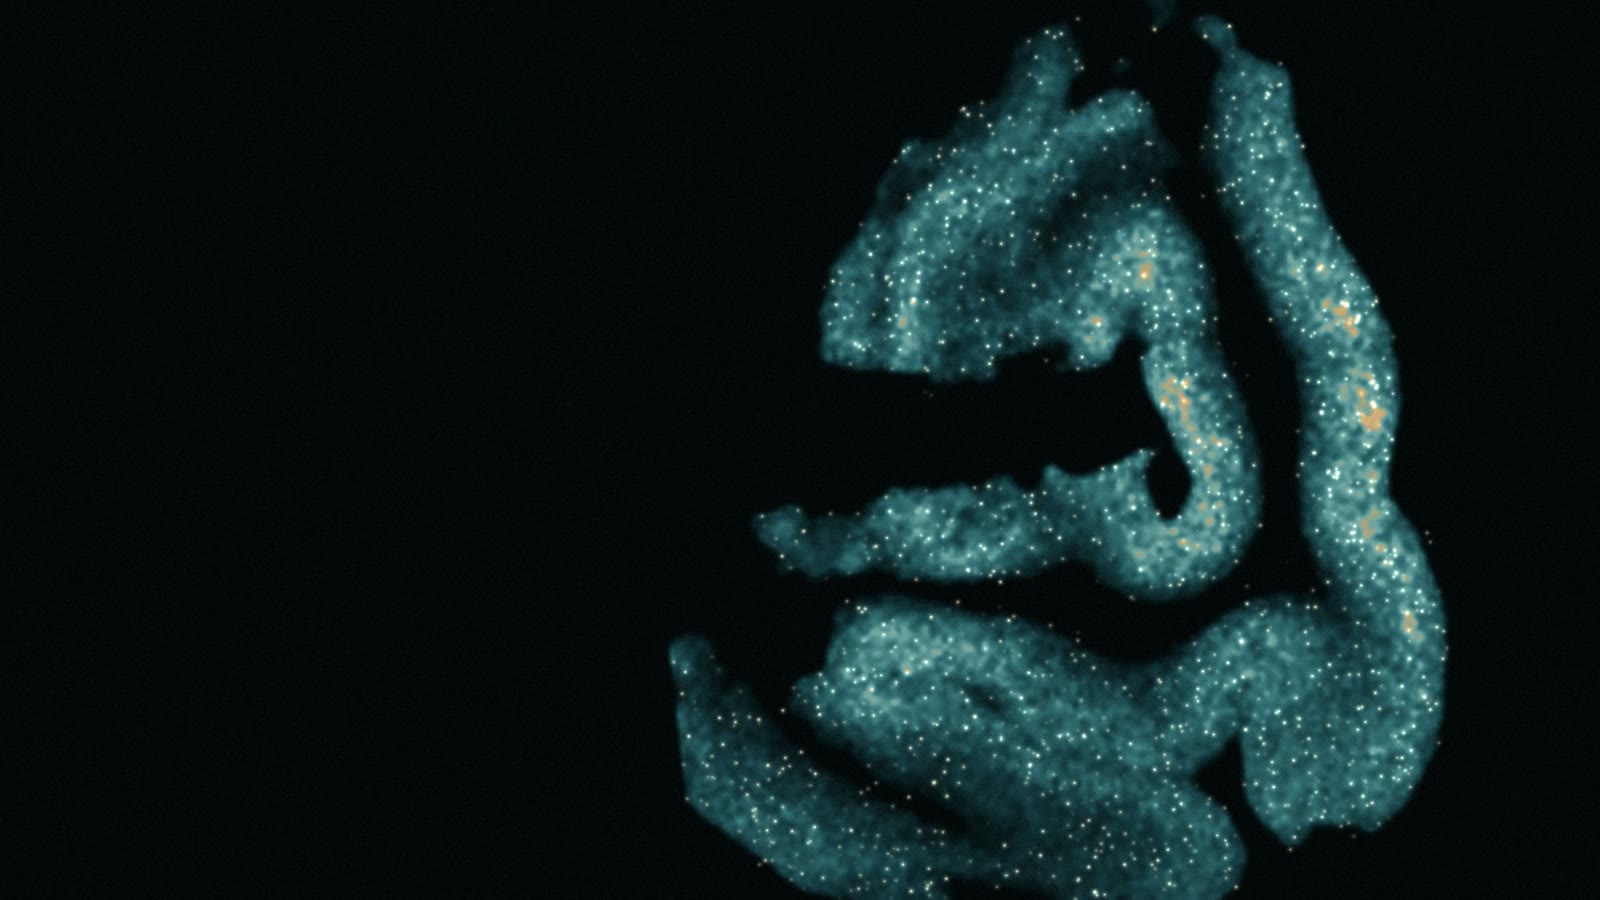
The published result: [11C]yohimbine binding in a minipig brain, from kinetic modelling of the scan.
Simulated Detection and reconstruction (filtered back-projection with counting noise), using the published map as if it were a map of radioactivity.
Published data The final frame: [11C]yohimbine VT, a binding measure from kinetic modelling; minipig, baseline, coronal slice. Landau et al., Biomolecules 2023 · doi:10.3390/biom13040674 · CC BY 4.0, cropped; text labels removed.
Scan the same brain again, and the map can change.
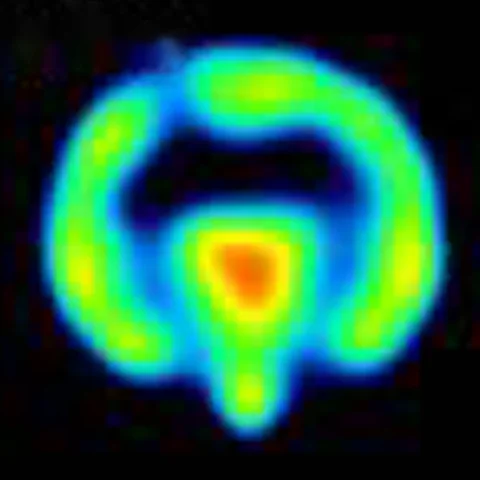
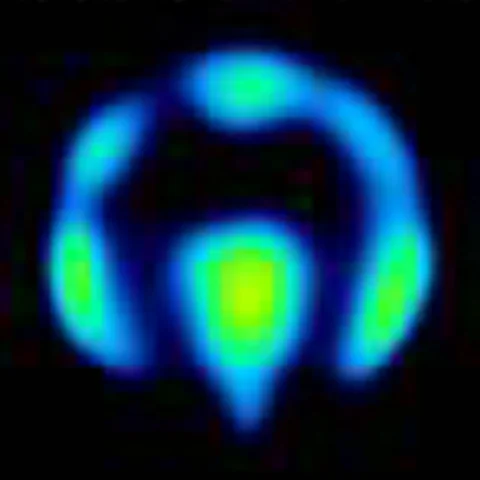
[11C]yohimbine binds α2 adrenoceptors. In minipigs its binding fell after drugs that raise noradrenaline, while microdialysis in the same animals measured the rise in extracellular noradrenaline; the two changes were inversely correlated. This supports the use of changes in [11C]yohimbine binding as an indirect marker of noradrenaline release, with microdialysis providing complementary measurements of extracellular noradrenaline.
Published data [11C]yohimbine VT in a minipig, same colour scale: baseline, and 8 minutes and 4 hours after nisoxetine, a drug that raises noradrenaline. Landau et al., Biomolecules 2023 · doi:10.3390/biom13040674 · CC BY 4.0, cropped; text labels removed.
Four research themes, connected by a shared platform of imaging methods and biological validation.
1Scroll: the drawing follows the theme you are reading.
2Press the buttons under Try it to see what changes.
Schematic: drawn for illustration, not data.
Scale · molecule
01
02
03
04
Schematic
cAMP
01Theme
Dopamine signalling and GPR6
We study dopamine signalling and the role of the G protein-coupled receptor 6 (GPR6) in striatal function and in stress- and depression-related behaviour — and develop tools that lay the groundwork for imaging GPR6 in the living brain.
Try it Demo playing · press to take over
GPR6 is active even without a known activating molecule, and raises cAMP inside the cell. Add the inverse agonist and watch the cAMP meter.
What you are seeingGPR6 spans the cell membrane and signals through the G protein Gs, raising cAMP. CVN424, a GPR6 inverse agonist in clinical development for Parkinson's disease, turns that signal down; it remains investigational and is not an approved treatment.
Where imaging comes inThere is not yet an established PET tracer for GPR6. Our tool-development work lays the groundwork for future imaging of GPR6 in the living brain.
Film sourcesMolecules rendered by us from published atomic structures: GPR6 with Gs (PDB 8TYW) and with CVN424 (8T1W), adenylyl cyclase with Gαs (6R3Q); the membrane is built, and the motion and the amounts of cAMP are illustrative. Mouse brain section: Gpr6 in situ hybridization, Allen Mouse Brain Atlas, experiment 71247615 (image credit: Allen Institute; Lein et al., Nature 2007). Neurons: reconstructions from NeuroMorpho.Org (Goodliffe et al., PLoS One 2018; CC BY 4.0), spines and axons added for illustration. All sources
How do disease and treatments affect synaptic biology? We use UCB-J PET and autoradiography to investigate changes in SV2A binding in disease models and after therapeutic interventions, supported by complementary tissue analyses.
Try it · what changed? Demo playing · press to take over
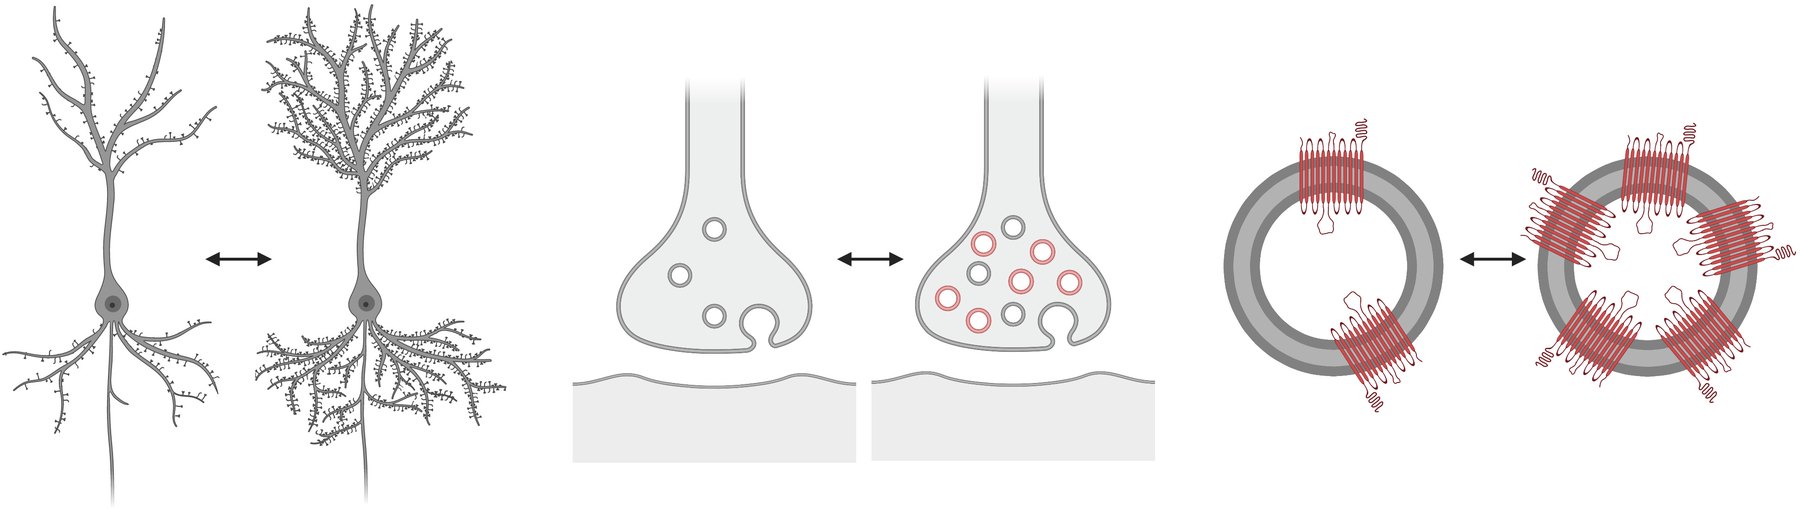
Two nerve terminals, each full of vesicles carrying SV2A. The tracer binds SV2A, so the signal follows how many SV2A sites are available to bind.
The pointEach change removes SV2A sites, and PET sees only the lower signal, not which change caused it. That is why we compare it with measurements in brain tissue.
We use PET to investigate how interventions such as deep brain stimulation and vagus nerve stimulation affect brain function and molecular processes, connecting animal models with clinical research.
Try it · choose the route Demo playing · press to take over
DBS delivers electrical pulses through a lead implanted deep in the brain. Pulses ripple out to connected regions.
From our papersIn healthy rats, [11C]UCB-J binding to SV2A was lower when the tracer was injected and the scan done straight after 30 minutes of transcutaneous auricular vagus nerve stimulation. [18F]FDG PET was done in other rats, with the tracer injected before stimulation and imaged later, and showed no detectable change in FDG uptake under the protocol tested; the two measurements sampled different physiological windows (Binda et al. 2025). In the pig, [18F]GE-179 uptake rose during hippocampal deep brain stimulation while blood flow did not change, consistent with activation of NMDA receptor ion channels under those conditions (Vibholm et al. 2020).
What you are seeingPulses from a DBS lead, or volleys arriving along the vagus nerve, ripple out to connected regions. Brain outline traced from the MNI152 template.
We develop and apply imaging approaches to study neuroinflammation and glial responses in models of neurological and psychiatric disease. Our current focus is on developing and validating new tracers, including for targets beyond TSPO, such as CSF1R. We also ask whether changes in GPR6 signalling are associated with neuroinflammatory responses.
Try it Demo playing · press to take over
Near a local insult, microglia pull in their branches, swell and, in many models, express more TSPO, one of the molecular targets for imaging neuroinflammation. Move your pointer over the drawing to move the insult.Tap the drawing to place the insult.
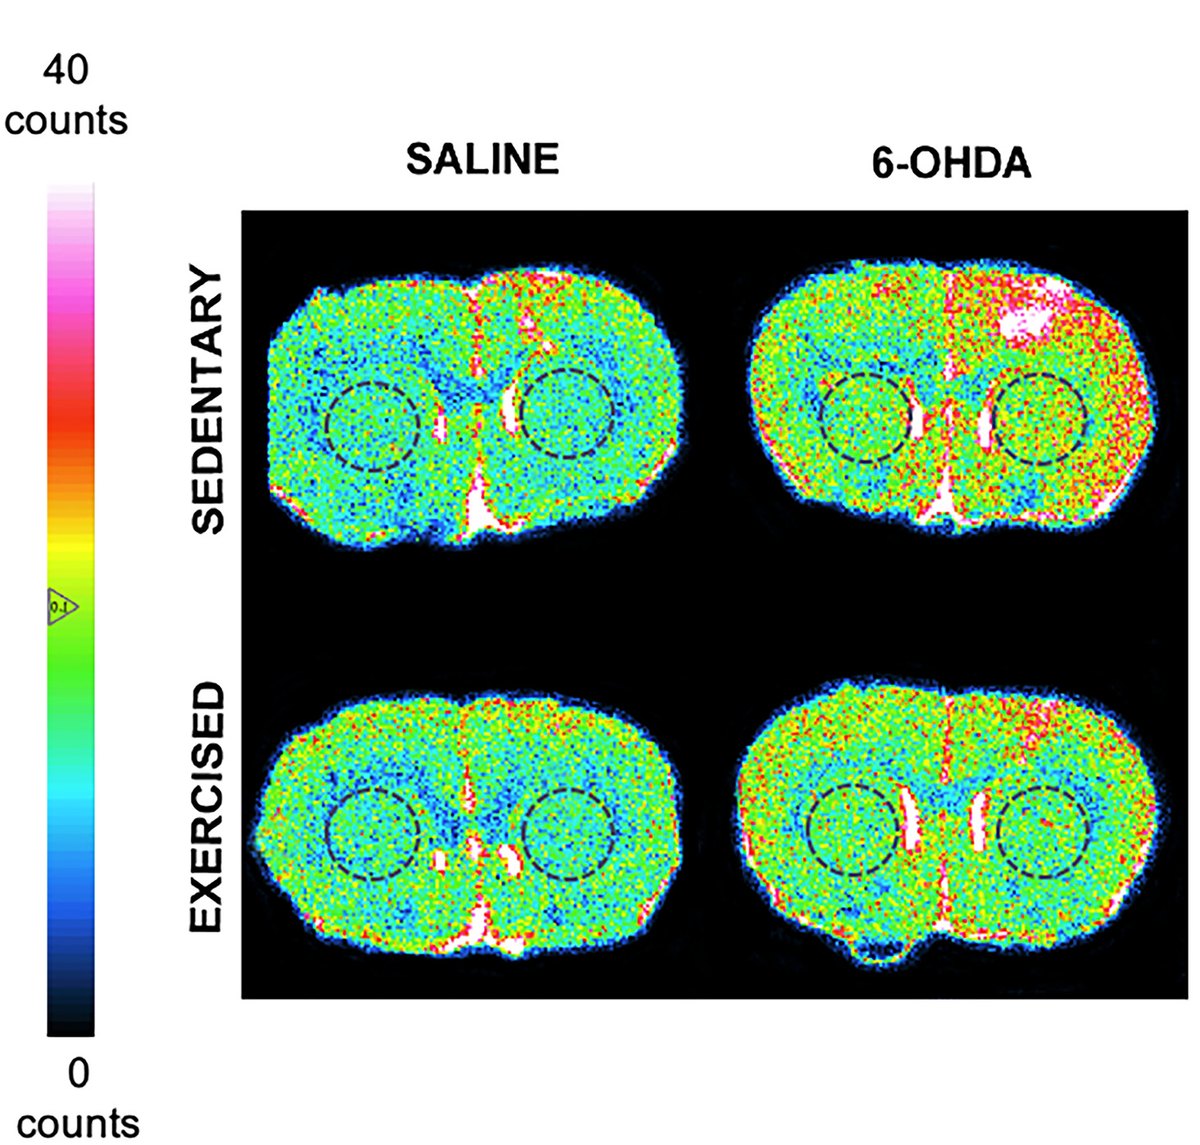
From our papers [3H]PK11195 autoradiography of TSPO binding in coronal rat brain sections through the striatum; representative sections, colour scale 0–40 counts. Injecting the toxin 6-OHDA into one striatum models Parkinson's disease. In sedentary rats, binding rose on the injected side (top right); in rats that then ran on a treadmill for five weeks, it did not (bottom right). Saline-injected controls are on the left. Binda et al., Exp Neurol 2021 · doi:10.1016/j.expneurol.2021.113741 · CC BY 4.0, Fig. 3A, cropped; panel letter removed.
Where we are headingMuch of this work is still unpublished. The theme page describes what we are investigating and how; published TSPO studies, like the one shown here, are its foundation. How TSPO binding is interpreted depends on species, model and cellular context.
In rats with a 6-OHDA lesion of one striatum, we measured several systems after five weeks of treadmill running. Sedentary lesioned rats lost SV2A binding in the striatum and substantia nigra on the injected side; in exercised lesioned rats it was comparable to saline-injected controls, and SV2A binding in hippocampus and thalamus was higher than in sedentary lesioned rats. Exercise also prevented the rise in TSPO binding, restored thalamic μ-opioid receptor binding and raised the pain threshold, while the dopamine deficit (D2/3 receptor binding, tyrosine hydroxylase staining) remained.
Binda et al., Exp Neurol 2021 · doi:10.1016/j.expneurol.2021.113741 · representative autoradiograms, Fig. 4A ([3H]UCB-J; colour scale in the original figure) and Fig. 3A ([3H]PK11195) · CC BY 4.0, cropped.
[3H]UCB-J binding to SV2A · 1 h after one dose of S-ketamine vs saline
Wistar Kyotomodel of depression
↑Nucleus accumbens
↑Dorsal hippocampus
↑Ventral hippocampus
Wistar Hannovercontrol strain
=No change
S-ketamine in a depression model
In Wistar Kyoto rats, a model of depression, one subanaesthetic dose of S-ketamine (15 mg/kg) increased SV2A binding one hour later, measured with [3H]UCB-J autoradiography; Wistar Hannover control rats showed no change. Hippocampal mRNA for SV2A and other synaptic markers did not change at that time. A rise in binding this soon shows a change in SV2A binding; on its own it does not show that new synapses formed.
Bærentzen et al., Neurosci Appl 2024 · doi:10.1016/j.nsa.2024.104079 · summary panel drawn for this page from the result reported in the abstract (figures not reused: CC BY-NC-ND).
Baseline
8 min after
4 h after
Yohimbine PET and microdialysis
In minipigs, [11C]yohimbine binding to α2 adrenoceptors fell after drugs that raise noradrenaline, while microdialysis in the same animals measured the rise in extracellular noradrenaline; the two changes were inversely correlated. This supports the use of changes in [11C]yohimbine binding as an indirect marker of noradrenaline release, with microdialysis providing complementary measurements of extracellular noradrenaline.
Landau et al., Biomolecules 2023 · doi:10.3390/biom13040674 · [11C]yohimbine VT, minipig, after nisoxetine · CC BY 4.0, cropped; labels removed.
No single measurement tells the whole story. We combine PET and quantitative autoradiography with behavioural testing and analyses of brain tissue — so that each can test, sharpen or explain what the others show.
Where the measurements overlap, evidence is strongest. None of them has to come first.
PET · the living brain
Sees where a tracer binds in the living brain, over time — repeatable in the same animal, and used in people too.
Alone, can't resolve fine anatomical detail, or say which cellular change lies behind a change in binding.
Autoradiography & tissue · brain sections
Sees binding on thin brain sections at far finer detail, with specificity checked directly — alongside histological, molecular and neurochemical analyses.
Alone, can't follow change over time: each brain gives one time point.
Behaviour · function
Sees what animals do — for example motor function, sensitivity to pain, or behaviours used to model aspects of depression.
Alone, can't explain mechanism: behaviour has many causes.
A worked example
When two methods agree
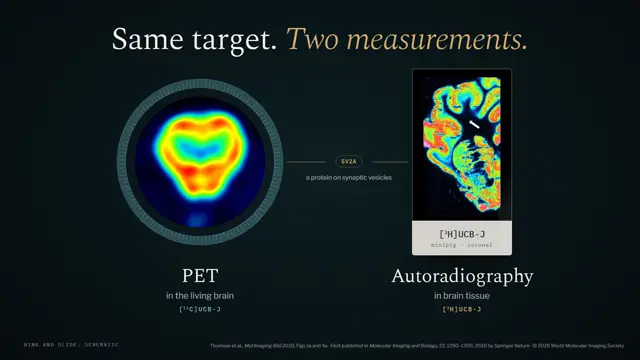
In rats with a one-sided striatal lesion made with quinolinic acid at two doses, [11C]UCB-J PET in the living brain and [3H]UCB-J autoradiography of brain sections found closely matching losses of SV2A binding on the lesioned side. In minipigs, agreement depended mainly on grey–white matter contrast, so it is tested region by region (Thomsen et al. 2020).
Another check. The study behind the [11C]yohimbine maps at stop 01 tested the PET signal against microdialysis: a direct measure of extracellular noradrenaline, taken at the same time in the same animals.
Loss of SV2A binding, lesioned vs intact side
20 µg QA
39.3%
38.4%
40 µg QA
55.1%
52.5%
0204060%
[11C]UCB-J PET, living brain[3H]UCB-J autoradiography, sections
Published data Thomsen et al., J Cereb Blood Flow Metab 2021 · doi:10.1177/0271678X20931140. QA, quinolinic acid. PET values are VT.
Before comparing PET with autoradiography, the study tested whether the PET signal really comes from SV2A. The same healthy rat was scanned twice: at baseline, and after a dose of levetiracetam, an anti-seizure drug that binds SV2A. Levetiracetam reduces the tracer's specific binding to SV2A: after the dose, the [11C]UCB-J image all but disappears, and the tracer peaks earlier and clears faster.
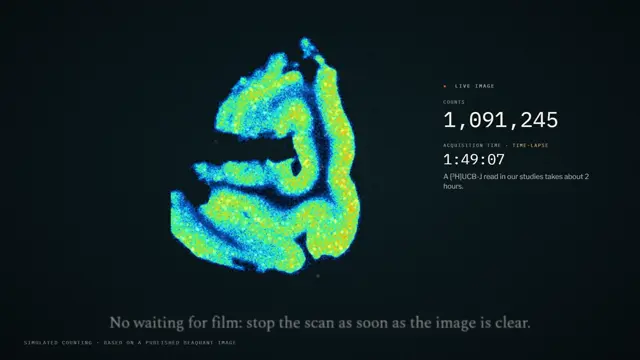
Simulated Counts are placed according to a real BeaQuant image of minipig prefrontal cortex: Bærentzen et al., Neuropharmacology 2024 · doi:10.1016/j.neuropharm.2024.110018 · CC BY 4.0.
Real-time autoradiography
Counting every particle, as it happens
The BeaQuant detector counts the particles given off by a radiolabelled brain section, one by one, and builds a quantitative image while we watch.
It complements PET. PET follows a target in the living brain; autoradiography maps it in tissue, in far finer detail, with tritium tracers that can't be used for PET. Many of our collaborations run through it.
Rats and mice let us combine imaging with detailed behavioural testing and tissue analyses in larger groups, and use genetic and pharmacological approaches to change a target directly.
Minipigs
Minipigs have larger, folded brains that can be scanned on clinical PET/CT systems, with arterial blood sampling for full quantification — which brings preclinical measurements closer to those in people.
Collaborations in radiochemistry, MRI, molecular biology, histology and neurosurgery support tracer development and validation, experimental interventions and interpretation of imaging findings.
Published dataPET in Göttingen minipigs. μ-opioid ([11C]carfentanil) and dopamine D2/3 ([11C]raclopride) receptor binding before and after sucrose. Brain sections from the same sucrose-drinking minipigs were later mapped with autoradiography (Bærentzen et al., Neuropharmacology 2024). Winterdahl et al., Sci Rep 2019;9:16918 · doi:10.1038/s41598-019-53430-9 · CC BY 4.0, whole figure, unmodified.
Want to see which measurements answer which question?
Translational Neuropsychiatry Unit · Department of Clinical Medicine · Aarhus University
Anne leads the lab's work in translational molecular neuroimaging: how brain disorders and treatments affect molecular signalling and brain function, with a particular focus on Parkinson's disease and depression.
Anthony Vernon of King's College London was inaugurated as Honorary Skou Professor at Aarhus University on 8 October 2026, the day after his pre-inaugural lecture, “From Brain to Cell and Back”, on 7 October.
Iavazzo C, et al. describe [³H]5-MOP, a novel and selective radiotracer for the colony stimulating factor-1 receptor (CSF1R), in EJNMMI Research (published 5 October 2026). Jens D. Mikkelsen is the senior author; Annie Landau is one of the co-authors.
A 14-minute narrated lecture that follows [¹¹C]UCB-J through seven steps, from a research question to studies in people, using the lab's own rat and minipig data, with five pause-and-think questions.
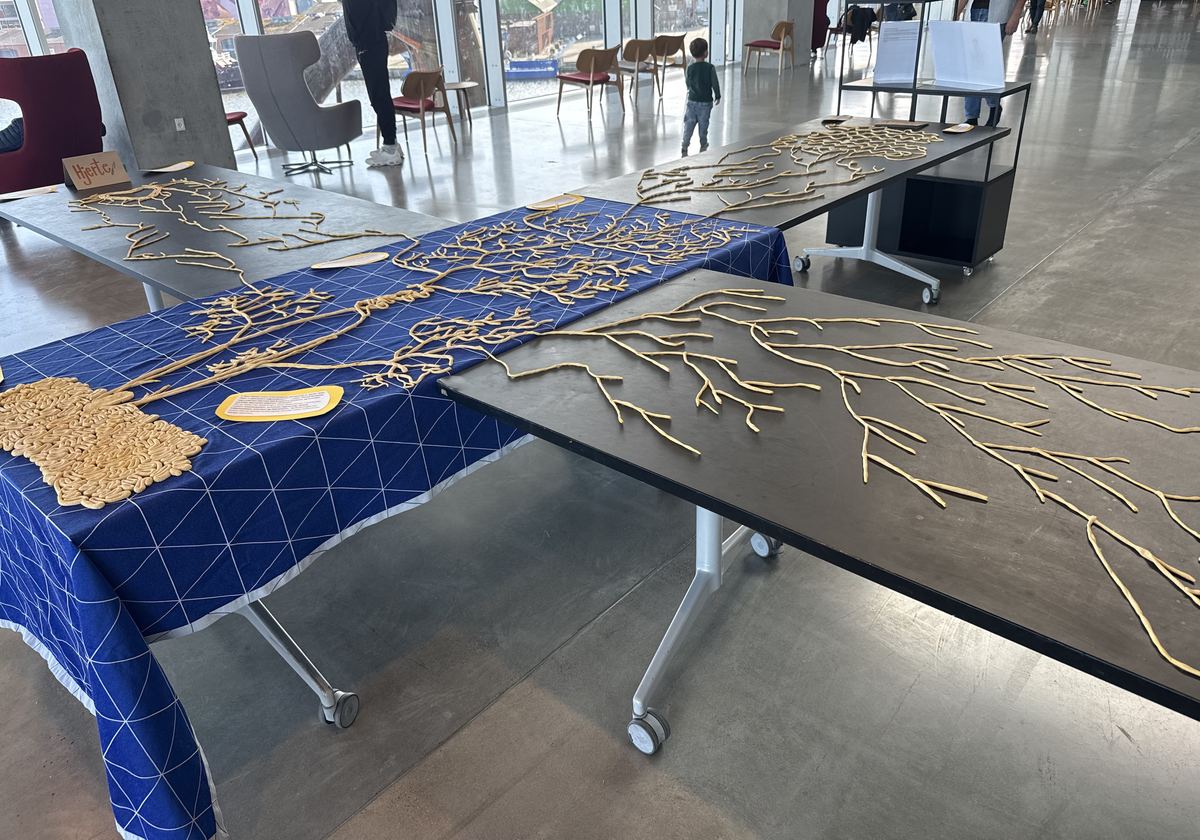
At Folkeuniversitetet's Hearts & Minds festival at Dokk1 in Aarhus, the exhibit “The Wandering Nerve” highlighted the lab's research on transcutaneous vagus nerve stimulation. In a workshop with Dokk1's science communicator Matilda Tjellden, participants built a large model of the vagus nerve, which stayed on display over the weekend for visitors to draw on and around.
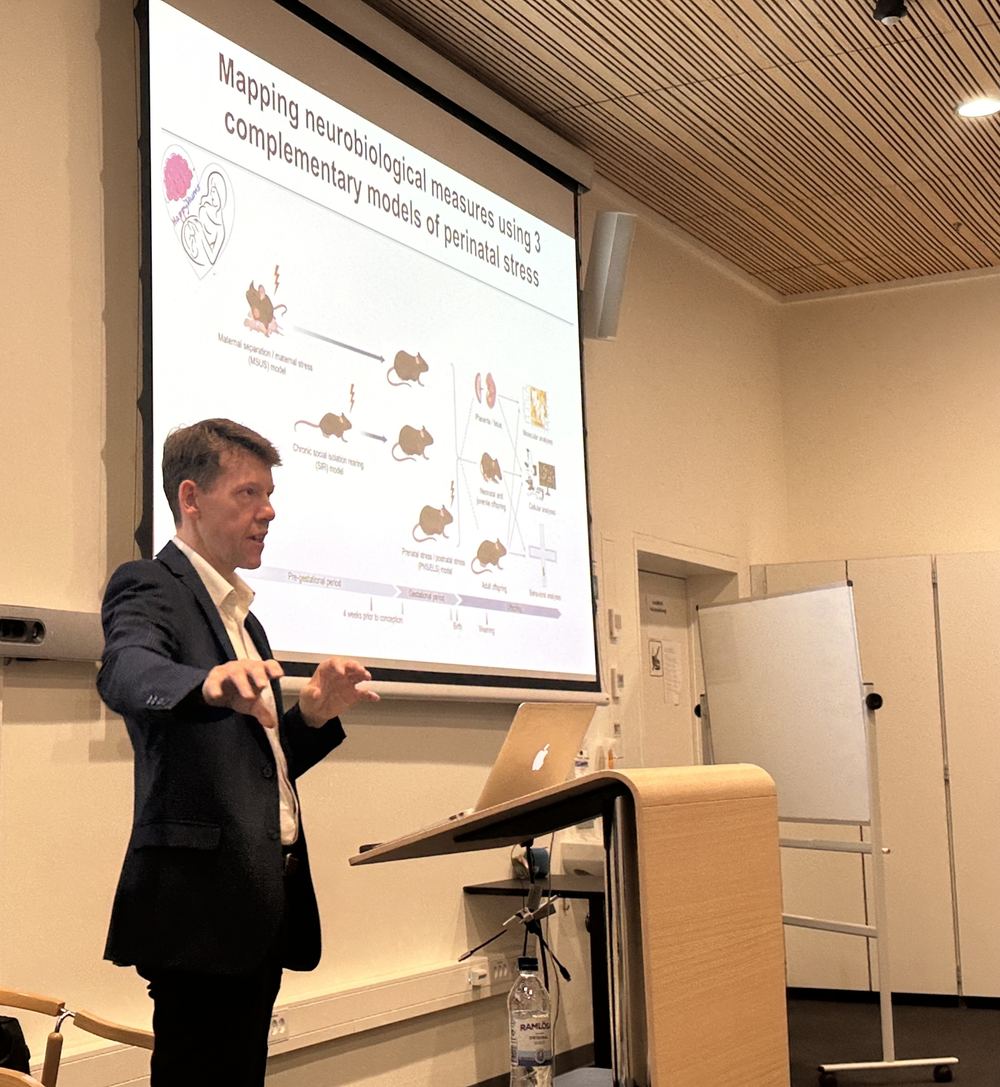
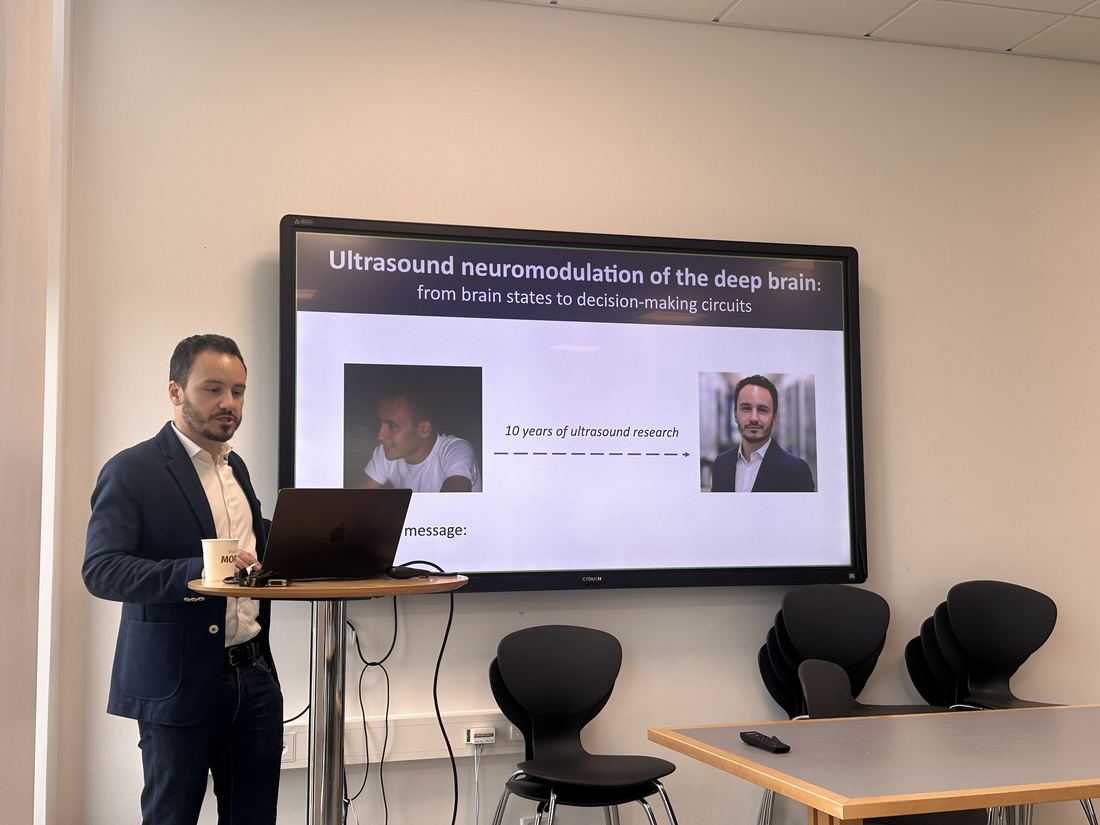
Davide Folloni, a former ERASMUS student in the lab and now an ERC Starting Grant holder at UniSR (Università Vita-Salute San Raffaele), spoke at TNU about using neuroimaging and focused ultrasound to study deep brain circuits for mood, learning and decision-making.
Lab life
Frederik Gudmundsen teaching
Arezou Fathalizadeh Alamdari's TNU lecture: GPR6 in neurodevelopment
Anne M. Landau's peer-reviewed record since 2003, including earlier collaborations, one dot per paper. Choose a theme to see where it runs through the years.
The dots, counts and chips come from the same records as the publications page: published, peer-reviewed papers only; preprints are not counted. Compiled from ORCID, Crossref and PubMed, checked in September 2026 and updated in October 2026. Some papers belong to more than one theme, some to none. Hover or tap a dot for the title.
![Published PET map of a minipig brain, coronal slice: [11C]yohimbine binding, highest in the centre of the brain.](/assets/home-c/img/real-coronal.webp)
![Fig. 4A: [3H]UCB-J autoradiograms of coronal rat brain sections at the striatum, saline or 6-OHDA, sedentary or exercised; dashed circles mark the striatum.](/assets/figures/binda2021-expneurol-fig4a.jpg)
![Published figure, two panels. A: three rows of rat brain images in coronal, sagittal and transverse views. Top row, MRI template in grey. Middle row, [11C]UCB-J PET at baseline, bright green to red across the brain on a colour scale of 0 to 6 grams per millilitre. Bottom row, the same rat after levetiracetam: almost uniformly dark blue. B: two graphs of standardised uptake value against time over 90 minutes for striatum, thalamus, frontal cortex, hippocampus, amygdala and cerebellum; at baseline (left) the curves rise to about 4 to 6.5 and fall slowly, after levetiracetam (right) they peak within minutes and fall below 1 by 90 minutes.](/assets/figures/thomsen2021-jcbfm-fig1-author-file.jpg)
![Published figure: PET images of minipig brains in sagittal view. Top rows: [11C]carfentanil binding potential at baseline, after initial sucrose exposure and after 12 days of exposure. Bottom row: [11C]raclopride binding potential at baseline and after 12 days.](/assets/home-c/img/winterdahl2019-scirep-fig1.jpg)